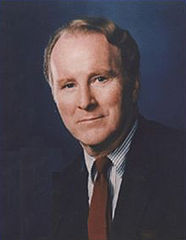
1996 United States presidential election
| |||||||||||||||||||||||||||||||||||||
538 members of the Electoral College 270 electoral votes needed to win | |||||||||||||||||||||||||||||||||||||
|---|---|---|---|---|---|---|---|---|---|---|---|---|---|---|---|---|---|---|---|---|---|---|---|---|---|---|---|---|---|---|---|---|---|---|---|---|---|
| Turnout | 51.7%[1] | ||||||||||||||||||||||||||||||||||||
| |||||||||||||||||||||||||||||||||||||
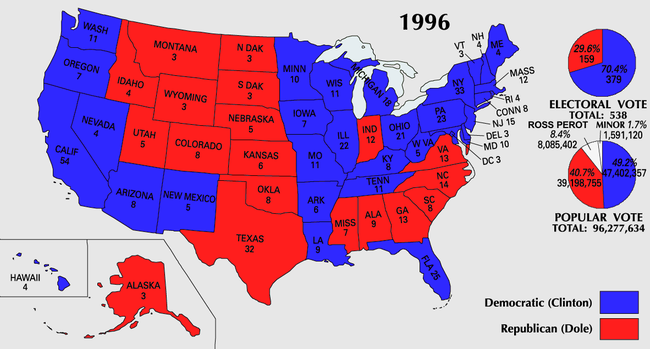
 Presidential election results map. Blue denotes states won by Clinton/Gore and red denotes those won by Dole/Kemp. Numbers indicate electoral votes cast by each state and the District of Columbia. | |||||||||||||||||||||||||||||||||||||
| |||||||||||||||||||||||||||||||||||||
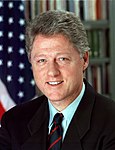
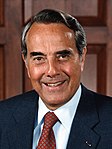
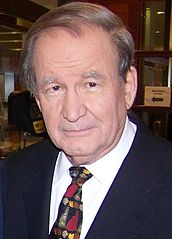
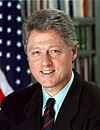
Presidential elections were held in the United States on November 5, 1996.[2] Incumbent Democratic President Bill Clinton and his running mate, incumbent Democratic Vice President Al Gore were re-elected to a second and final term, defeating the Republican ticket of former Senate Majority Leader Bob Dole and former Secretary of Housing and Urban Development Jack Kemp and the Reform ticket of businessman Ross Perot and economist Pat Choate.
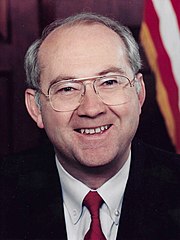
Clinton and Vice President Al Gore were re-nominated without incident by the Democratic Party. Numerous candidates entered the 1996 Republican primaries, with Dole considered the early frontrunner. Dole clinched the nomination after defeating challenges by publisher Steve Forbes and paleoconservative leader Pat Buchanan. Dole's running mate was Jack Kemp, a former congressman and football player who had served as the housing secretary under President George H. W. Bush. Ross Perot, who had won 18.9% of the popular vote as an independent candidate in the 1992 election, ran as the candidate of the Reform Party. Perot received less media attention in 1996 and was excluded from the presidential debates.
Clinton's chances of winning were initially considered slim in the middle of his term, as his party had lost both the House of Representatives and the Senate in 1994 for the first time in decades. He was able to regain ground as the economy began to recover from the early 1990s recession with a relatively stable world stage. Clinton tied Dole to Newt Gingrich, the unpopular Republican speaker of the House, and warned that Republicans would increase the deficit and slash spending on popular programs like Social Security and Medicare. Dole promised an across-the-board 15% reduction in federal income taxes and labeled Clinton as a member of the "spoiled" Baby Boomer generation. Dole's age was a persistent issue in the election, and gaffes by Dole exacerbated the issue for his campaign.
On election day, Clinton defeated Dole by a wide margin, winning 379 electors to Dole's 159 and taking 49.2% of the national popular vote to Dole's 40.7%. As in 1992, Perot's strong candidacy held both major party candidates below 50% nationwide. Notably, Clinton's strength with many southern and rural whites makes him the last Democrat to carry the states of Kentucky, Louisiana, West Virginia, Arkansas, Missouri, and Tennessee in a presidential election. He was also the last Democrat to win Arizona until 2020.
This was the first presidential election since 1944 in which an incumbent Democratic president won a second full term in office. It is the most recent election in which the Democratic presidential nominee never served as a senator. This is also the only presidential election between 1980 and 2004 in which a Bush did not appear on the Republican ticket, the last winning Democratic ticket that did not have Joe Biden on it, and the most recent election when the Republican candidate would win fewer than 20 states. It also has the lowest voter turnout in US history, and is to date the only election where less than half of eligible voters showed up.[3]
Background
[edit]In 1995, the Republican Party was riding high on the significant gains made in the 1994 mid-term elections. In those races, the Republicans, led by whip Newt Gingrich, captured the majority of seats in the House for the first time in forty years and the majority of seats in the Senate for the first time in eight years. Gingrich became speaker of the House, while Bob Dole was elevated to Senate Majority leader.
The Republicans of the 104th Congress pursued an ambitious agenda, highlighted by their Contract with America, but were often forced to compromise with Clinton, who wielded veto power. A budget impasse between Congress and the Clinton Administration eventually resulted in a government shutdown. Clinton, meanwhile, was praised for signing the GOP's welfare reform, and other notable bills, but was forced to abandon his own health care plan.
Democratic Party nomination
[edit]
| ||
|---|---|---|
|
Personal 40th and 42nd Governor of Arkansas 42nd President of the United States Tenure Appointments Presidential campaigns
|
||
| ||
|---|---|---|
|
Vice President of the United States
Presidential campaigns
Vice presidential campaigns
|
||
Democratic Candidates
- Bill Clinton, President of the United States
- Lyndon LaRouche, Activist from Virginia
- Jimmy Griffin, Former Mayor of Buffalo from New York
 | |||||||||||||||||||||||||||||
| Bill Clinton | Al Gore | ||||||||||||||||||||||||||||
|---|---|---|---|---|---|---|---|---|---|---|---|---|---|---|---|---|---|---|---|---|---|---|---|---|---|---|---|---|---|
| for President | for Vice President | ||||||||||||||||||||||||||||
 |
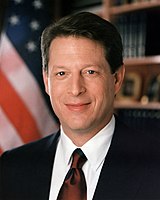 | ||||||||||||||||||||||||||||
| 42nd President of the United States (1993–2001) |
45th Vice President of the United States (1993–2001) | ||||||||||||||||||||||||||||
| Campaign | |||||||||||||||||||||||||||||
 | |||||||||||||||||||||||||||||
Candidates gallery
[edit]With the advantage of incumbency, Bill Clinton's path to renomination by the Democratic Party was uneventful. At the 1996 Democratic National Convention, Clinton and incumbent Vice President Al Gore were renominated with token opposition. Formerly incarcerated fringe candidate Lyndon LaRouche won a few Arkansas delegates who were barred from the convention. Jimmy Griffin, former Mayor of Buffalo, New York, mounted a brief campaign but withdrew after a poor showing in the New Hampshire primary. Former Pennsylvania governor Bob Casey contemplated a challenge to Clinton, but health problems forced Casey to abandon a bid.[4][5]
Clinton easily won primaries nationwide, with margins consistently higher than 80%.
Popular primaries vote:[6]
- Bill Clinton (inc.) – 9,730,184 (88.5%)
- Lyndon LaRouche – 597,081 (5.4%)
- Unpledged – 423,265 (3.8%)
Convention tally:[7]
- Bill Clinton (inc.) – 4,277
- Not voting – 12
Republican Party nomination
[edit]Republican Candidates
- Bob Dole, U.S. Senator from Kansas and Republican nominee for Vice President of the United States in 1976
- Pat Buchanan, conservative columnist from Virginia
- Steve Forbes, newspaper and magazine publisher from New York
- Lamar Alexander, former governor of Tennessee
- Phil Gramm, U.S. Senator from Texas
- Alan Keyes, former U.S. ECOSOC Ambassador from Maryland
- Richard Lugar, U.S. Senator from Indiana
- Bob Dornan, U.S. Representative from California
- Arlen Specter, U.S. Senator from Pennsylvania
- Pete Wilson, Governor of California
- Morry Taylor, CEO from Michigan
 | |||||||||||||||||||||||||||||
| Bob Dole | Jack Kemp | ||||||||||||||||||||||||||||
|---|---|---|---|---|---|---|---|---|---|---|---|---|---|---|---|---|---|---|---|---|---|---|---|---|---|---|---|---|---|
| for President | for Vice President | ||||||||||||||||||||||||||||
 |
 | ||||||||||||||||||||||||||||
| U.S. Senator from Kansas (1969–1996) |
9th U.S. Secretary of Housing and Urban Development (1989–1993) | ||||||||||||||||||||||||||||
| Campaign | |||||||||||||||||||||||||||||
 | |||||||||||||||||||||||||||||
Candidates gallery
[edit]A number of Republican candidates entered the field to challenge the incumbent Democratic president, Bill Clinton.
The fragmented field of candidates debated issues such as a flat tax and other tax cut proposals, and a return to supply-side economic policies popularized by Ronald Reagan. More attention was drawn to the race by the budget stalemate in 1995 between Congress and the president, which caused temporary shutdowns and slowdowns in many areas of federal government service.
Former Secretary of Labor Lynn Martin of Illinois, who served in the United States House of Representatives from Illinois's 16th District and was the 1990 Republican U.S. Senate nominee losing to incumbent Paul Simon conducted a bid for most of 1995, but withdrew before the Iowa caucuses as polls showed her languishing far behind. She participated in a number of primary presidential debates before withdrawing.[8] Martin's predecessor in Congress, John Anderson had made first a Republican then independent presidential bid in 1980. Also, Simon who defeated Martin for the U.S. Senate had run for president as a Democrat in 1988.
Former U.S. Army General Colin Powell was widely courted as a potential Republican nominee. However, on November 8, 1995, Powell announced that he would not seek the nomination. Former Secretary of Defense and future Vice President of the United States Dick Cheney was touted by many as a possible candidate for the presidency, but he declared his intentions not to run in early 1995. Former and future Defense Secretary Donald Rumsfeld formed a presidential campaign exploratory committee, but declined to formally enter the race. Former Secretary of State James A. Baker III and former Secretary of Education William Bennett both flirted with bids, both even set up exploratory committees, for a number of months but both finally declared within days of each other they would not run either.[9]
Primaries and convention
[edit]Ahead of the 1996 primary contest, Republican Leader of the United States Senate and former vice-presidential candidate Bob Dole was seen as the most likely winner. However, Steve Forbes finished first in Delaware and Arizona while paleoconservative firebrand Pat Buchanan managed early victories in Alaska and Louisiana, in addition to a strong second place in the Iowa caucuses and a surprising victory in the small but key New Hampshire primary. Buchanan's New Hampshire win alarmed the Republican "establishment" sufficiently as to provoke prominent Republicans to quickly coalesce around Dole,[10] and Dole won every primary starting with North and South Dakota. Dole resigned his Senate seat on June 11 and the Republican National Convention formally nominated Dole on August 15, 1996, for president.
Popular primaries vote:[6]
- Bob Dole – 8,427,601 (59.2%)
- Pat Buchanan – 3,021,935 (21.2%)
- Steve Forbes – 1,425,998 (10.0%)
- Lamar Alexander – 495,590 (3.5%)
- Alan Keyes – 449,536 (3.2%)
- Richard Lugar – 127,111 (0.9%)
- Unpledged – 123,765 (0.9%)
- Phil Gramm – 71,457 (0.5%)
- Bob Dornan – 42,141 (0.3%)
- Morry Taylor – 21,180 (0.1%)
Convention tally:[11]
- Bob Dole – 1928
- Pat Buchanan – 43
- Phil Gramm – 2
- Alan Keyes – 1
- Robert Bork – 1
- Not voting – 15
Former Representative and Housing Secretary Jack Kemp was nominated by acclamation for vice president, the following day. This was the only Republican ticket between 1980 and 2004 that did not include a member of the Bush family.
Reform Party nomination
[edit]| 1996 Reform Party ticket | |||||||||||||||||||||||||||||
| Ross Perot | Pat Choate | ||||||||||||||||||||||||||||
|---|---|---|---|---|---|---|---|---|---|---|---|---|---|---|---|---|---|---|---|---|---|---|---|---|---|---|---|---|---|
| for President | for Vice President | ||||||||||||||||||||||||||||
 |
 | ||||||||||||||||||||||||||||
| President and CEO of Perot Systems (1988–2009) |
Economist | ||||||||||||||||||||||||||||
| Campaign | |||||||||||||||||||||||||||||
 | |||||||||||||||||||||||||||||
Candidates gallery
[edit]-
Party founder Ross Perot, from Texas
The United States Reform Party had great difficulty in finding a candidate willing to run in the general election. Lowell Weicker, Tim Penny, David Boren and Richard Lamm were among those who toyed with the notion of seeking its presidential nomination, though all but Lamm decided against it; Lamm had himself come close to withdrawing his name from consideration. Lamm designated Ed Zschau as his vice presidential candidate.
Ultimately, the Reform Party nominated its founder Ross Perot from Texas in its first election as an official political party. Although Perot easily won the nomination, his victory at the party's national convention led to a schism as supporters of Lamm accused him of rigging the vote to prevent them from casting their ballots. This faction walked out of the national convention and eventually formed their own group, the American Reform Party, and attempted to convince Lamm to run as an Independent in the general election; Lamm declined, pointing out a promise he made before running that he would respect the Party's final decision.
Economist Pat Choate was nominated for Vice President.
Minor parties and independents
[edit]Parties in this section obtained ballot access in enough states to theoretically obtain the minimum number of electoral votes needed to win the election. Individuals included in this section completed one or more of the following actions: received, or formally announced their candidacy for, the presidential nomination of a third party; formally announced intention to run as an independent candidate and obtained enough ballot access to win the election; filed as a third party or non-affiliated candidate with the FEC (for other than exploratory purposes). Within each party, candidates are listed alphabetically by surname.
| Minor party candidates, 1996 | |||||||||||||||||||||||||||||
| Libertarian | Green | Natural Law | U.S. Taxpayers' | ||||||||||||||||||||||||||
|---|---|---|---|---|---|---|---|---|---|---|---|---|---|---|---|---|---|---|---|---|---|---|---|---|---|---|---|---|---|
| Harry Browne | Ralph Nader | John Hagelin | Howard Phillips | ||||||||||||||||||||||||||
 |
 |
 |
 | ||||||||||||||||||||||||||
| Investment analyst | Author and consumer advocate |
Scientist and researcher |
Conservative political activist | ||||||||||||||||||||||||||
Libertarian Party nomination
[edit]
Libertarian candidates
- Harry Browne – writer and investment analyst from Tennessee
- Rick Tompkins – former candidate for Senator from Arizona
- Irwin Schiff – writer and prominent figure in the tax protester movement from Nevada
- Douglas J. Ohmen – political activist from California
- Jeffrey Diket – political activist from Louisiana
The Libertarian Party nominated free-market writer and investment analyst, Harry Browne from Tennessee, and selected Jo Jorgensen from South Carolina as his running-mate. Browne and Jorgensen drew 485,798 votes (0.5% of the popular vote).
| Presidential Ballot | 1st |
|---|---|
| Harry Browne | 416 |
| Rick Tompkins | 74 |
| None | 61 |
| Irwin Schiff | 32 |
| Douglas J. Ohmen | 20 |
| Jeffrey Diket | 1 |
| Jo Jorgensen | 1 |
Green Party nomination
[edit]
The Green Party of the United States drafted Ralph Nader of Connecticut as a candidate for President of the United States on the Green Party ticket. He was not formally nominated by the Green Party USA, which was, at the time, the largest national Green group; instead, he was nominated independently by various state Green parties (in some areas, he appeared on the ballot as an independent). Nader vowed to spend only $5,000 in his election campaign (to avoid having to file a financial statement with the FEC). Winona LaDuke, a Native American activist and economist from Wisconsin, was named as his running-mate. In Iowa and Vermont, Anne Goeke was listed as Nader's running mate; in New Jersey it was Madelyn Hoffman and in New York it was Muriel Tillinghast.
Nader and his running mates drew 685,128 votes (0.71% of the popular vote).
Natural Law Party nomination
[edit]
The Natural Law Party for a second time nominated scientist and researcher John Hagelin for president and Mike Tompkins for vice president. The party platform included preventive health care, sustainable agriculture and renewable energy technologies. During his campaigns, Hagelin favored abortion rights without public financing, campaign finance law reform, improved gun control, a flat tax, the eradication of PACs, a ban on soft money contributions, and school vouchers, and was a believer in "yogic flying."
Hagelin and Tompkins drew 113,671 votes (0.1% of the popular vote).
U.S. Taxpayers' Party nomination
[edit]
The U.S. Taxpayers Party had run its first presidential ticket in 1992, headed by Howard Phillips, who had failed to find any prominent conservative willing to take the mantle. In 1996 the situation ultimately proved the same, though Pat Buchanan for a time was widely speculated to be planning on bolting to the Taxpayers' Party should the expected Republican nominee, Senator Bob Dole, name a pro-choice running-mate. When Jack Kemp, who opposed abortion, was tapped for the position Buchanan agreed to endorse the Republican ticket. Phillips again led the Taxpayers ticket, with Herbert Titus nominated for the vice presidency.
Phillips and Titus drew 182,820 votes (0.2% of the popular vote).
General election
[edit]Campaign
[edit]Without meaningful primary opposition, Clinton was able to focus on the general election early, while Dole was forced to move to the right and spend his campaign reserves fighting off challengers. Political adviser Dick Morris urged Clinton to raise huge sums of campaign funds via soft money for an unprecedented early TV blitz of swing states promoting Clinton's agenda and record. As a result, Clinton could run a campaign through the summer defining his opponent as an aged conservative far from the mainstream before Dole was in a position to respond. Compared to the 50-year-old Clinton, then 73-year-old Dole appeared especially old and frail, as illustrated by an embarrassing fall off a stage during a campaign event in Chico, California. Dole further enhanced this contrast on September 18 when he made a reference to a no-hitter thrown the day before by Hideo Nomo of the "Brooklyn Dodgers", a team that had left Brooklyn for Los Angeles 38 years earlier. A few days later Dole would make a joke about the remark by saying, "And I'd like to congratulate the St. Louis Cardinals on winning the N.L. Central. Notice I said the St. Louis Cardinals, not the St. Louis Browns." (The Browns had left St. Louis after the 1954 season to become the Baltimore Orioles.)
Dole chose to focus on Clinton as being "part of the spoiled baby boomer generation"[citation needed] and said, "My generation won [World War II], and we may need to be called to service one last time." Although his message won appeal with older voters, surveys found that his age was widely held as a liability and his frequent allusions to WWII and the Great Depression in speeches and campaign ads "unappealing" to younger voters. To prove that he was still healthy and active, Dole released all of his medical records to the public and published photographs of himself running on a treadmill. After the falling incident in California, he joked that he "was trying to do that new Democratic dance, the macarena."[12]
The Clinton campaign avoided mentioning Dole's age directly, choosing to confront it in more subtle ways such as the slogan "Building Bridges to the Future" in contrast to the Republican candidate's frequent remarks that he was a "bridge to the past", before the social upheavals of the 1960s. Clinton, without actually calling Dole old, questioned the age of his ideas.[13]

With respect to the issues, Dole promised a 15% across-the-board reduction in income tax rates and made former congressman and supply side advocate Jack Kemp his running mate. Bill Clinton framed the narrative against Dole early, painting him as a mere clone of unpopular House speaker Newt Gingrich, warning America that Bob Dole would work in concert with the Republican Congress to slash popular social programs, like Medicare and Social Security, dubbed by Clinton as "Dole-Gingrich".[14] Bob Dole's tax-cut plan found itself under attack from the White House, who said it would "blow a hole in the deficit," which had been cut nearly in half during his opponent's term.[15]
The televised debates featured only Dole and Clinton, locking out Perot and the other minor candidates from the discussion. Perot, who had been allowed to participate in the 1992 debates, would eventually take his case to court, seeking damages from not being in the debate, as well as citing unfair coverage from the major media outlets.
In a first for either major party in a presidential election, both the Clinton and Dole campaigns had official websites. Dole invited viewers to visit his "homepage" at the end of the first debate.[16]
Throughout the campaign, Clinton maintained leads in the polls over Dole and Perot, generally by large margins. In October, Republican National Committee "operatives urg[ed] their party's Congressional candidates to cut loose from Bob Dole and press voters to maintain a Republican majority"[17] and spent $4 million on advertising in targeted districts.[18]
Presidential debates
[edit]Three debates, organized by the Commission on Presidential Debates, took place—two between the presidential candidates and one between the vice presidential candidates:
| No. | Date | Host | Location | Moderators | Participants | Viewership (millions) |
|---|---|---|---|---|---|---|
| P1 | Sunday, October 6, 1996 | Bushnell Center for the Performing Arts | Hartford, Connecticut | Jim Lehrer | President Bill Clinton Senator Bob Dole |
46.1[19] |
| VP | Wednesday, October 9, 1996 | Mahaffey Theater | St. Petersburg, Florida | Jim Lehrer | Vice President Al Gore Secretary Jack Kemp |
26.6[19] |
| P2 | Wednesday, October 16, 1996 | University of San Diego | San Diego, California | Jim Lehrer | President Bill Clinton Senator Bob Dole |
36.6[19] |
Campaign donations controversy
[edit]In late September 1995, questions arose regarding the Democratic National Committee's fund-raising practices. In February the following year, China's alleged role in the campaign finance controversy first gained public attention after The Washington Post published a story stating that a U.S. Department of Justice investigation had discovered evidence that agents of China sought to direct contributions from foreign sources to the DNC before the 1996 presidential campaign. The paper wrote that intelligence information had showed the Chinese Embassy in Washington, D.C. was used for coordinating contributions to the DNC[20] in violation of U.S. law forbidding non-American citizens from giving monetary donations to U.S. politicians and political parties. Seventeen people were eventually convicted for fraud or for funneling Asian funds into the U.S. elections.
One of the more notable events learned involved Vice President Al Gore and a fund-raising event held at Hsi Lai Temple in Hacienda Heights, California. The Temple event was organized by DNC fund-raisers John Huang and Maria Hsia. It is illegal under U.S. law for religious organizations to donate money to politicians or political groups due to their tax-exempt status. The U.S. Justice Department alleged Hsia facilitated $100,000 (~$179,387 in 2023) in illegal contributions to the 1996 Clinton-Gore re-election campaign through her efforts at the Temple. Hsia was eventually convicted by a jury in March 2000.[21] The DNC eventually returned the money donated by the Temple's monks and nuns. Twelve nuns and employees of the Temple refused to answer questions by pleading the Fifth Amendment when they were subpoenaed to testify before Congress in 1997.[22]
Results
[edit]On election day, President Clinton won a decisive victory over Dole, becoming the first Democrat to win two consecutive presidential elections since Franklin D. Roosevelt in 1936, 1940, and 1944. In the popular vote, he out-polled Dole by over 8.2 million votes. The Electoral College map did not change much from the previous election, with the Democratic incumbent winning 379 votes to the Republican ticket's 159. In the West, Dole managed to narrowly win Colorado and Montana (both had voted for Clinton four years earlier), while Clinton became the first Democrat to win Arizona since Harry Truman in 1948. In the South, Clinton won Florida, a state he had failed to win in 1992, but lost Georgia, a state that he had carried. The election helped to cement Democratic presidential control in California, Vermont, Maine, Illinois, New Jersey and Connecticut; all went on to vote Democratic in every subsequent presidential election after having voted Republican in the five prior to 1992. 1996 marked the first time that Vermont voted for a Democrat in two successive elections. Pennsylvania and Michigan both voted Democratic, and would remain in the Democratic presidential fold until 2016.
Although Clinton's margin of victory in the popular vote was slightly greater than that of George H.W. Bush eight years prior, he won fewer states, in part due to his relatively poor performance in areas of low population density – a precursor of the trend where future Democratic contenders for the presidency perform very well in populous metropolitan areas but vastly underperform in rural counties.
Reform Party nominee Ross Perot won approximately 8% of the popular vote. His vote total was less than half of his performance in 1992. The 1996 national exit poll showed that just as in 1992,[23] Perot drew supporters from Clinton and Dole equally.[24] In polls directed at Perot voters as to who would be a second choice, Clinton consistently held substantial leads.[25] Perot's best showing was in states that tended to strongly favor either Clinton (such as Maine) or Dole (particularly Montana, though the margin of victory there was much closer). Perot once again received his lowest amount of support in the South.
Although Clinton is a native of Arkansas and his running mate hailed from Tennessee, the Democratic ticket carried just four of the eleven states of the former Confederacy (and of those four only Florida and Georgia have voted Democratic in any election since). As such, Clinton's 1992 run was tied for the weakest performance in the region by a nationally successful Democratic presidential candidate up until that point. Clinton's performance both followed and preceded a substantial decline in support for the Democratic Party in the South; in the 2000 and 2004 elections, the Democrats would fail to carry even one of the former Confederate states, contributing to their defeat both times. This completed the Republican takeover of the American South, a region in which Democrats had held a near monopoly from 1880 to 1948. In 2008, the Democrats were able to win three former Confederate states (Virginia, North Carolina, and Florida), however this was still a worse performance than either of Clinton's. Since 1984, no winning presidential candidate has surpassed Bill Clinton's 8.5 percent popular vote margin, or his 220 electoral vote margin since 1988. Additionally, since 1964, no other Democratic presidential candidate has surpassed Clinton's electoral vote margin and, except Lyndon B. Johnson in that election, no Democratic presidential candidate has surpassed Clinton's 8.5 percentage popular vote margin since 1940.
The election also marked the first time in U.S. history that the winner was elected without winning the male vote, the third time in U.S. history that a candidate won two terms as president without winning a majority either time (after Grover Cleveland and Woodrow Wilson, both Democrats).[24] Clinton also remains the last presidential candidate of either party to win at least one county in every state.[26] Clinton maintained a consistent polling edge over Dole, and he won re-election with a substantial margin in the popular vote and the Electoral College. Clinton became the first Democrat since Franklin D. Roosevelt to win two consecutive presidential elections. Dole won 40.7% of the popular vote and 159 electoral votes, while Perot won 8.4% of the popular vote. Despite Dole's defeat, the Republican Party was able to maintain majorities in both the House of Representatives and the Senate. Voter turnout was registered at 51.7%, the lowest for a presidential election since 1924.
As of 2020, this remains the last time that the states of Kentucky, Louisiana, West Virginia, Arkansas, Missouri, and Tennessee were carried by a Democratic presidential nominee. It was also the first time most Arizona voters chose a Democratic candidate since 1948,[27] which they would not do again until 2020. Five states switched party predominance in 1996 with their presidential voting: Montana, Colorado, and Georgia were flipped by Senator Dole, while Florida and Arizona were flipped by President Clinton. This is also the most recent time a third-party candidate finished with over 5% of the vote nationwide. This is the last time a Democratic president was re-elected with a higher share of the electoral or popular vote, while also being the last time when an incumbent Democratic candidate would flip any states (Arizona, and Florida in this instance) which they failed to win in their previous election bid.
| Presidential candidate | Party | Home state | Popular vote | Electoral vote |
Running mate | |||
|---|---|---|---|---|---|---|---|---|
| Count | Percentage | Vice-presidential candidate | Home state | Electoral vote | ||||
| Bill Clinton (incumbent) | Democratic[a] | Arkansas | 47,401,185 | 49.24% | 379 | Al Gore (incumbent) | Tennessee | 379 |
| Bob Dole | Republican[b] | Kansas | 39,197,469 | 40.71% | 159 | Jack Kemp | New York[29] | 159 |
| Ross Perot | Reform[c] | Texas | 8,085,294 | 8.40% | 0 | Patrick Choate[d] | Washington, D.C. | 0 |
| Ralph Nader | Green | Connecticut | 684,871 | 0.71% | 0 | Winona LaDuke[e] | California | 0 |
| Harry Browne | Libertarian | Tennessee | 485,759 | 0.50% | 0 | Jo Jorgensen | South Carolina | 0 |
| Howard Phillips | Taxpayers | Virginia | 184,656 | 0.19% | 0 | Herbert Titus | Oregon | 0 |
| John Hagelin | Natural Law | Iowa | 113,667 | 0.12% | 0 | Mike Tompkins | Massachusetts | 0 |
| Other[f] | 121,663 | 0.12% | — | Other[f] | — | |||
| Total | 96,274,564 | 100% | 538 | 538 | ||||
| Needed to win | 270 | 270 | ||||||
Official Source (Popular Vote): 1996 Official Presidential General Election Results
Source (popular and electoral vote): Federal Elections Commission Electoral and Popular Vote Summary unofficial Secondary Source (Popular Vote): Leip, David. "1996 Presidential Election Results". Dave Leip's Atlas of U.S. Presidential Elections. Retrieved August 7, 2005.
Voting age population: 196,498,000
Percent of voting age population casting a vote for President: 49.00%
-
Results by congressional district, shaded according to winning candidate's percentage of the vote.
-
Results by county, shaded according to winning candidate's percentage of the vote.
-
Change in vote margins at the county level from the 1992 election to the 1996 election.
Results by state
[edit]Source: [33]
| States/districts won by Clinton/Gore | |
| States/districts won by Dole/Kemp | |
| † | At-large results (For states that split electoral votes) |
| Bill Clinton Democratic |
Bob Dole Republican |
Ross Perot Reform |
Ralph Nader Green |
Harry Browne Libertarian |
Others | Margin | State Total | ||||||||||||||||
|---|---|---|---|---|---|---|---|---|---|---|---|---|---|---|---|---|---|---|---|---|---|---|---|
| State | electoral votes |
# | % | electoral votes |
# | % | electoral votes |
# | % | electoral votes |
# | % | electoral votes |
# | % | electoral votes |
# | % | electoral votes |
# | % | # | |
| Alabama | 9 | 662,165 | 43.16% | – | 769,044 | 50.12% | 9 | 92,149 | 6.01% | – | – | – | – | 5,290 | 0.34% | – | 5,701 | 0.37% | – | −106,879 | −6.96% | 1,534,349 | AL |
| Alaska | 3 | 80,380 | 33.27% | – | 122,746 | 50.80% | 3 | 26,333 | 10.90% | – | 7,597 | 3.14% | – | 2,276 | 0.94% | – | 2,288 | 0.95% | – | −42,366 | −17.53% | 241,620 | AK |
| Arizona | 8 | 653,288 | 46.52% | 8 | 622,073 | 44.29% | – | 112,072 | 7.98% | – | 2,062 | 0.15% | – | 14,358 | 1.02% | – | 552 | 0.04% | – | 31,215 | 2.23% | 1,404,405 | AZ |
| Arkansas | 6 | 475,171 | 53.74% | 6 | 325,416 | 36.80% | – | 69,884 | 7.90% | – | 3,649 | 0.41% | – | 3,076 | 0.35% | – | 7,066 | 0.80% | – | 149,755 | 16.94% | 884,262 | AR |
| California | 54 | 5,119,835 | 51.10% | 54 | 3,828,380 | 38.21% | – | 697,847 | 6.96% | – | 237,016 | 2.37% | – | 73,600 | 0.73% | – | 62,806 | 0.63% | – | 1,291,455 | 12.89% | 10,019,484 | CA |
| Colorado | 8 | 671,152 | 44.43% | – | 691,848 | 45.80% | 8 | 99,629 | 6.59% | – | 25,070 | 1.66% | – | 12,392 | 0.82% | – | 10,613 | 0.70% | – | −20,696 | −1.37% | 1,510,704 | CO |
| Connecticut | 8 | 735,740 | 52.83% | 8 | 483,109 | 34.69% | – | 139,523 | 10.02% | – | 24,321 | 1.75% | – | 5,788 | 0.42% | – | 4,133 | 0.30% | – | 252,631 | 18.14% | 1,392,614 | CT |
| Delaware | 3 | 140,355 | 51.80% | 3 | 99,062 | 36.58% | – | 28,719 | 10.60% | – | 18 | 0.01% | – | 2,052 | 0.76% | – | 639 | 0.24% | – | 41,293 | 15.22% | 270,845 | DE |
| D.C. | 3 | 158,220 | 85.19% | 3 | 17,339 | 9.34% | – | 3,611 | 1.94% | – | 4,780 | 2.57% | – | 588 | 0.32% | – | 1,188 | 0.64% | – | 140,881 | 75.85% | 185,726 | DC |
| Florida | 25 | 2,546,870 | 48.02% | 25 | 2,244,536 | 42.32% | – | 483,870 | 9.12% | – | 4,101 | 0.08% | – | 23,965 | 0.45% | – | 452 | 0.01% | – | 302,334 | 5.70% | 5,303,794 | FL |
| Georgia | 13 | 1,053,849 | 45.84% | – | 1,080,843 | 47.01% | 13 | 146,337 | 6.37% | – | – | – | – | 17,870 | 0.78% | – | 172 | 0.01% | – | −26,994 | −1.17% | 2,299,071 | GA |
| Hawaii | 4 | 205,012 | 56.93% | 4 | 113,943 | 31.64% | – | 27,358 | 7.60% | – | 10,386 | 2.88% | – | 2,493 | 0.69% | – | 928 | 0.26% | – | 91,069 | 25.29% | 360,120 | HI |
| Idaho | 4 | 165,443 | 33.65% | – | 256,595 | 52.18% | 4 | 62,518 | 12.71% | – | – | – | – | 3,325 | 0.68% | – | 3,838 | 0.78% | – | −91,152 | −18.53% | 491,719 | ID |
| Illinois | 22 | 2,341,744 | 54.32% | 22 | 1,587,021 | 36.81% | – | 346,408 | 8.03% | – | 1,447 | 0.03% | – | 22,548 | 0.52% | – | 12,223 | 0.29% | – | 754,723 | 17.51% | 4,311,391 | IL |
| Indiana | 12 | 887,424 | 41.55% | – | 1,006,693 | 47.13% | 12 | 224,299 | 10.50% | – | 1,121 | 0.05% | – | 15,632 | 0.73% | – | 673 | 0.03% | – | −119,269 | −5.58% | 2,135,842 | IN |
| Iowa | 7 | 620,258 | 50.26% | 7 | 492,644 | 39.92% | – | 105,159 | 8.52% | – | 6,550 | 0.53% | – | 2,315 | 0.19% | – | 7,149 | 0.58% | – | 127,614 | 10.34% | 1,234,075 | IA |
| Kansas | 6 | 387,659 | 36.08% | – | 583,245 | 54.29% | 6 | 92,639 | 8.62% | – | 914 | 0.09% | – | 4,557 | 0.42% | – | 5,286 | 0.49% | – | −195,586 | −18.21% | 1,074,300 | KS |
| Kentucky | 8 | 636,614 | 45.84% | 8 | 623,283 | 44.88% | – | 120,396 | 8.67% | – | 701 | 0.05% | – | 4,009 | 0.29% | – | 3,705 | 0.27% | – | 13,331 | 0.96% | 1,388,708 | KY |
| Louisiana | 9 | 927,837 | 52.01% | 9 | 712,586 | 39.94% | – | 123,293 | 6.91% | – | 4,719 | 0.26% | – | 7,499 | 0.42% | – | 8,025 | 0.45% | – | 215,251 | 12.07% | 1,783,959 | LA |
| Maine† | 2 | 312,788 | 51.62% | 2 | 186,378 | 30.76% | – | 85,970 | 14.19% | – | 15,279 | 2.52% | – | 2,996 | 0.49% | – | 2,486 | 0.41% | – | 126,410 | 20.86% | 605,897 | ME |
| Maine-1 | 1 | 165,053 | 52.1% | 1 | 100,851 | 31.8% | – | 39,845 | 12.6% | – | – | – | – | – | – | – | 11,372 | 3.6% | – | 64,202 | 20.3% | 317,121 | ME1 |
| Maine-2 | 1 | 147,735 | 51.2% | 1 | 85,527 | 29.6% | – | 46,125 | 16.0% | – | – | – | – | – | – | – | 9,389 | 3.3% | – | 62,208 | 21.5% | 288,776 | ME2 |
| Maryland | 10 | 966,207 | 54.25% | 10 | 681,530 | 38.27% | – | 115,812 | 6.50% | – | 2,606 | 0.15% | – | 8,765 | 0.49% | – | 5,950 | 0.33% | – | 284,677 | 15.98% | 1,780,870 | MD |
| Massachusetts | 12 | 1,571,763 | 61.47% | 12 | 718,107 | 28.08% | – | 227,217 | 8.89% | – | 4,565 | 0.18% | – | 20,426 | 0.80% | – | 14,708 | 0.58% | – | 853,656 | 33.39% | 2,556,786 | MA |
| Michigan | 18 | 1,989,653 | 51.69% | 18 | 1,481,212 | 38.48% | – | 336,670 | 8.75% | – | 2,322 | 0.06% | – | 27,670 | 0.72% | – | 11,317 | 0.29% | – | 508,441 | 13.21% | 3,848,844 | MI |
| Minnesota | 10 | 1,120,438 | 51.10% | 10 | 766,476 | 34.96% | – | 257,704 | 11.75% | – | 24,908 | 1.14% | – | 8,271 | 0.38% | – | 14,843 | 0.68% | – | 353,962 | 16.14% | 2,192,640 | MN |
| Mississippi | 7 | 394,022 | 44.08% | – | 439,838 | 49.21% | 7 | 52,222 | 5.84% | – | – | – | – | 2,809 | 0.31% | – | 4,966 | 0.56% | – | −45,816 | −5.13% | 893,857 | MS |
| Missouri | 11 | 1,025,935 | 47.54% | 11 | 890,016 | 41.24% | – | 217,188 | 10.06% | – | 534 | 0.02% | – | 10,522 | 0.49% | – | 13,870 | 0.64% | – | 135,919 | 6.30% | 2,158,065 | MO |
| Montana | 3 | 167,922 | 41.23% | – | 179,652 | 44.11% | 3 | 55,229 | 13.56% | – | – | – | – | 2,526 | 0.62% | – | 1,932 | 0.47% | – | −11,730 | −2.88% | 407,261 | MT |
| Nebraska† | 2 | 236,761 | 34.95% | – | 363,467 | 53.65% | 2 | 71,278 | 10.52% | – | – | – | – | 2,792 | 0.41% | – | 3,117 | 0.46% | – | −126,706 | −18.70% | 677,415 | NE |
| Nebraska-1 | 1 | 87,713 | 38.1% | – | 114,560 | 49.7% | 1 | 25,973 | 11.3% | – | – | – | – | – | – | – | 2,074 | 0.9% | – | -28,847 | -11.7% | 230,330 | NE1 |
| Nebraska-2 | 1 | 84,666 | 38.0% | – | 116,892 | 52.5% | 1 | 18,935 | 8.5% | – | – | – | – | – | – | – | 2,164 | 1.0% | – | -32,226 | -14.5% | 222,660 | NE2 |
| Nebraska-3 | 1 | 64,382 | 28.7% | – | 132,015 | 58.8% | 1 | 26,370 | 11.8% | – | – | – | – | – | – | – | 1,658 | 0.7% | – | -67,633 | -30.1% | 224,425 | NE3 |
| Nevada | 4 | 203,974 | 43.93% | 4 | 199,244 | 42.91% | – | 43,986 | 9.47% | – | 4,730 | 1.02% | – | 4,460 | 0.96% | – | 7,885 | 1.70% | – | 4,730 | 1.02% | 464,279 | NV |
| New Hampshire | 4 | 246,214 | 49.32% | 4 | 196,532 | 39.37% | – | 48,390 | 9.69% | – | – | – | – | 4,237 | 0.85% | – | 3,802 | 0.76% | – | 49,682 | 9.95% | 499,175 | NH |
| New Jersey | 15 | 1,652,329 | 53.72% | 15 | 1,103,078 | 35.86% | – | 262,134 | 8.52% | – | 32,465 | 1.06% | – | 14,763 | 0.48% | – | 11,038 | 0.36% | – | 549,251 | 17.86% | 3,075,807 | NJ |
| New Mexico | 5 | 273,495 | 49.18% | 5 | 232,751 | 41.86% | – | 32,257 | 5.80% | – | 13,218 | 2.38% | – | 2,996 | 0.54% | – | 1,357 | 0.24% | – | 40,744 | 7.32% | 556,074 | NM |
| New York | 33 | 3,756,177 | 59.47% | 33 | 1,933,492 | 30.61% | – | 503,458 | 7.97% | – | 75,956 | 1.20% | – | 12,220 | 0.19% | – | 34,826 | 0.55% | – | 1,822,685 | 28.86% | 6,316,129 | NY |
| North Carolina | 14 | 1,107,849 | 44.04% | – | 1,225,938 | 48.73% | 14 | 168,059 | 6.68% | – | 2,108 | 0.08% | – | 8,740 | 0.35% | – | 3,113 | 0.12% | – | −118,089 | −4.69% | 2,515,807 | NC |
| North Dakota | 3 | 106,905 | 40.13% | – | 125,050 | 46.94% | 3 | 32,515 | 12.20% | – | – | – | – | 847 | 0.32% | – | 1,094 | 0.41% | – | −18,145 | −6.81% | 266,411 | ND |
| Ohio | 21 | 2,148,222 | 47.38% | 21 | 1,859,883 | 41.02% | – | 483,207 | 10.66% | – | 2,962 | 0.07% | – | 12,851 | 0.28% | – | 27,309 | 0.60% | – | 288,339 | 6.36% | 4,534,434 | OH |
| Oklahoma | 8 | 488,105 | 40.45% | – | 582,315 | 48.26% | 8 | 130,788 | 10.84% | – | – | – | – | 5,505 | 0.46% | – | – | – | – | −94,210 | −7.81% | 1,206,713 | OK |
| Oregon | 7 | 649,641 | 47.15% | 7 | 538,152 | 39.06% | – | 121,221 | 8.80% | – | 49,415 | 3.59% | – | 8,903 | 0.65% | – | 10,428 | 0.76% | – | 111,489 | 8.09% | 1,377,760 | OR |
| Pennsylvania | 23 | 2,215,819 | 49.17% | 23 | 1,801,169 | 39.97% | – | 430,984 | 9.56% | – | 3,086 | 0.07% | – | 28,000 | 0.62% | – | 27,060 | 0.60% | – | 414,650 | 9.20% | 4,506,118 | PA |
| Rhode Island | 4 | 233,050 | 59.71% | 4 | 104,683 | 26.82% | – | 43,723 | 11.20% | – | 6,040 | 1.55% | – | 1,109 | 0.28% | – | 1,679 | 0.43% | – | 128,367 | 32.89% | 390,284 | RI |
| South Carolina | 8 | 506,283 | 43.96% | – | 573,458 | 49.79% | 8 | 64,386 | 5.59% | – | – | – | – | 4,271 | 0.37% | – | 3,291 | 0.29% | – | −67,175 | −5.83% | 1,151,689 | SC |
| South Dakota | 3 | 139,333 | 43.03% | – | 150,543 | 46.49% | 3 | 31,250 | 9.65% | – | – | – | – | 1,472 | 0.45% | – | 1,228 | 0.38% | – | −11,210 | −3.46% | 323,826 | SD |
| Tennessee | 11 | 909,146 | 48.00% | 11 | 863,530 | 45.59% | – | 105,918 | 5.59% | – | 6,427 | 0.34% | – | 5,020 | 0.27% | – | 4,064 | 0.21% | – | 45,616 | 2.41% | 1,894,105 | TN |
| Texas | 32 | 2,459,683 | 43.83% | – | 2,736,167 | 48.76% | 32 | 378,537 | 6.75% | – | 4,810 | 0.09% | – | 20,256 | 0.36% | – | 12,191 | 0.22% | – | −276,484 | −4.93% | 5,611,644 | TX |
| Utah | 5 | 221,633 | 33.30% | – | 361,911 | 54.37% | 5 | 66,461 | 9.98% | – | 4,615 | 0.69% | – | 4,129 | 0.62% | – | 6,880 | 1.03% | – | −140,278 | −21.07% | 665,629 | UT |
| Vermont | 3 | 137,894 | 53.35% | 3 | 80,352 | 31.09% | – | 31,024 | 12.00% | – | 5,585 | 2.16% | – | 1,183 | 0.46% | – | 2,411 | 0.93% | – | 57,542 | 22.26% | 258,449 | VT |
| Virginia | 13 | 1,091,060 | 45.15% | – | 1,138,350 | 47.10% | 13 | 159,861 | 6.62% | – | – | – | – | 9,174 | 0.38% | – | 18,197 | 0.75% | – | −47,290 | −1.95% | 2,416,642 | VA |
| Washington | 11 | 1,123,323 | 49.84% | 11 | 840,712 | 37.30% | – | 201,003 | 8.92% | – | 60,322 | 2.68% | – | 12,522 | 0.56% | – | 15,955 | 0.71% | – | 282,611 | 12.54% | 2,253,837 | WA |
| West Virginia | 5 | 327,812 | 51.51% | 5 | 233,946 | 36.76% | – | 71,639 | 11.26% | – | – | – | – | 3,062 | 0.48% | – | – | – | – | 93,866 | 14.75% | 636,459 | WV |
| Wisconsin | 11 | 1,071,971 | 48.81% | 11 | 845,029 | 38.48% | – | 227,339 | 10.35% | – | 28,723 | 1.31% | – | 7,929 | 0.36% | – | 15,178 | 0.69% | – | 226,942 | 10.33% | 2,196,169 | WI |
| Wyoming | 3 | 77,934 | 36.84% | – | 105,388 | 49.81% | 3 | 25,928 | 12.25% | – | – | – | – | 1,739 | 0.82% | – | 582 | 0.28% | – | −27,454 | −12.97% | 211,571 | WY |
| TOTALS: | 538 | 47,402,357 | 49.24% | 379 | 39,198,755 | 40.71% | 159 | 8,085,402 | 8.40% | – | 685,128 | 0.71% | – | 485,798 | 0.50% | – | 420,194 | 0.44% | – | 8,203,602 | 8.52% | 96,277,634 | US |
†Maine and Nebraska each allow for their electoral votes to be split between candidates. In both states, two electoral votes are awarded to the winner of the statewide race and one electoral vote is awarded to the winner of each congressional district.[34]
States that flipped from Democratic to Republican
[edit]States that flipped from Republican to Democratic
[edit]Close states
[edit]State where the margin of victory was under 1% (8 electoral votes):
- Kentucky, 0.96% (13,331 votes)
States where the margin of victory was under 5% (109 electoral votes):
- Nevada, 1.02% (4,730 votes)
- Georgia, 1.17% (26,994 votes)
- Colorado, 1.37% (20,696 votes)
- Virginia, 1.96% (47,290 votes)
- Arizona, 2.22% (31,215 votes)
- Tennessee, 2.41% (45,616 votes)
- Montana, 2.88% (11,730 votes)
- South Dakota, 3.46% (11,210 votes)
- North Carolina, 4.69% (118,089 votes)
- Texas, 4.93% (276,484 votes)
States where the margin of victory was between 5% and 10% (143 electoral votes):
- Mississippi, 5.13% (45,816 votes)
- Indiana, 5.58% (119,269 votes)
- Florida, 5.70% (302,334 votes)
- South Carolina, 6.04% (69,407 votes)
- Missouri, 6.30% (135,919 votes)
- Ohio, 6.36% (288,339 votes)
- North Dakota, 6.81% (18,145 votes)
- Alabama, 6.96% (106,879 votes)
- New Mexico, 7.32% (40,744 votes)
- Oklahoma, 7.81% (94,210 votes)
- Oregon, 8.09% (111,489 votes)
- Pennsylvania, 9.20% (414,650 votes) (tipping point state)
- New Hampshire, 9.95% (49,682 votes)
Statistics
[edit]Counties with Highest Percent of Vote (Democratic)
- Starr County, Texas 86.94%
- Bronx County, New York 85.80%
- Macon County, Alabama 85.55%
- Washington, D.C. 85.19%
- Duval County, Texas 84.94%
Counties with Highest Percent of Vote (Republican)
- Ochiltree County, Texas 79.20%
- Russell County, Kansas 78.98%
- Glasscock County, Texas 78.93%
- Hayes County, Nebraska 77.02%
- Sioux County, Iowa 77.00%
Counties with Highest Percent of Vote (Other)
- Mineral County, Montana 23.72%
- Grant County, North Dakota 21.55%
- Shoshone County, Idaho 21.55%
- Sanders County, Montana 21.24%
- Billings County, North Dakota 21.10%
Voter demographics
[edit]| The presidential vote in social groups (percentages) | |||||||
|---|---|---|---|---|---|---|---|
| Social group | Clinton | Dole | Perot | Others | % of total vote | ||
| Total vote | 49 | 41 | 8 | 2 | 100 | ||
| Party and ideology | |||||||
| Conservative Republicans | 6 | 88 | 5 | 1 | 21 | ||
| Moderate Republicans | 20 | 72 | 7 | 1 | 13 | ||
| Liberal Republicans | 44 | 46 | 9 | 1 | 2 | ||
| Conservative independents | 19 | 60 | 19 | 2 | 7 | ||
| Moderate independents | 50 | 30 | 17 | 3 | 15 | ||
| Liberal independents | 58 | 15 | 18 | 9 | 4 | ||
| Conservative Democrats | 69 | 23 | 7 | 1 | 6 | ||
| Moderate Democrats | 84 | 10 | 5 | 1 | 20 | ||
| Liberal Democrats | 89 | 5 | 4 | 2 | 13 | ||
| Gender and marital status | |||||||
| Married men | 40 | 48 | 10 | 2 | 32 | ||
| Married women | 48 | 43 | 7 | 2 | 33 | ||
| Unmarried men | 49 | 36 | 12 | 3 | 15 | ||
| Unmarried women | 62 | 28 | 7 | 3 | 20 | ||
| Race | |||||||
| White | 43 | 46 | 9 | 2 | 83 | ||
| Black | 84 | 11 | 4 | 1 | 10 | ||
| Hispanic | 72 | 21 | 6 | 1 | 5 | ||
| Asian | 43 | 48 | 8 | 1 | 1 | ||
| Religion | |||||||
| Protestant | 41 | 50 | 8 | 1 | 38 | ||
| Catholic | 53 | 37 | 9 | 1 | 29 | ||
| Other Christian | 45 | 41 | 12 | 2 | 16 | ||
| Jewish | 78 | 16 | 3 | 3 | 3 | ||
| Other | 60 | 23 | 11 | 6 | 6 | ||
| None | 59 | 23 | 13 | 5 | 7 | ||
| White Religious Right | |||||||
| White Religious Right | 26 | 65 | 8 | 1 | 17 | ||
| Everyone else | 54 | 35 | 9 | 2 | 83 | ||
| Age | |||||||
| 18–29 years old | 53 | 34 | 10 | 3 | 16 | ||
| 30–44 years old | 48 | 41 | 9 | 2 | 33 | ||
| 45–59 years old | 48 | 41 | 9 | 2 | 26 | ||
| 60 and older | 48 | 44 | 7 | 1 | 25 | ||
| First time voters | |||||||
| First time voter | 54 | 34 | 11 | 1 | 9 | ||
| Everyone else | 48 | 42 | 8 | 2 | 91 | ||
| Sexual orientation | |||||||
| Gay, lesbian, or bisexual | 66 | 23 | 7 | 4 | 5 | ||
| Heterosexual | 47 | 43 | 8 | 2 | 95 | ||
| Education | |||||||
| Not a high school graduate | 59 | 28 | 11 | 2 | 6 | ||
| High school graduate | 51 | 35 | 13 | 1 | 24 | ||
| Some college education | 48 | 40 | 10 | 2 | 27 | ||
| College graduate | 44 | 46 | 8 | 2 | 26 | ||
| Postgraduate education | 52 | 40 | 5 | 3 | 17 | ||
| Family income | |||||||
| Under $15,000 | 59 | 28 | 11 | 2 | 11 | ||
| $15,000–30,000 | 51 | 38 | 9 | 2 | 23 | ||
| $30,000–50,000 | 48 | 40 | 10 | 2 | 27 | ||
| $50,000–75,000 | 47 | 45 | 7 | 1 | 21 | ||
| $75,000–100,000 | 44 | 48 | 7 | 1 | 9 | ||
| Over $100,000 | 38 | 54 | 6 | 2 | 9 | ||
| Region | |||||||
| East | 55 | 34 | 9 | 2 | 23 | ||
| Midwest | 48 | 41 | 10 | 1 | 26 | ||
| South | 46 | 46 | 7 | 1 | 30 | ||
| West | 48 | 40 | 8 | 4 | 20 | ||
| Community size | |||||||
| Population over 500,000 | 68 | 25 | 5 | 2 | 10 | ||
| Population 50,000 to 500,000 | 50 | 39 | 8 | 3 | 21 | ||
| Suburbs | 47 | 42 | 8 | 3 | 39 | ||
| Rural areas, towns | 45 | 44 | 10 | 1 | 30 | ||
Source: Voter News Service exit poll, reported in The New York Times, November 10, 1996, 28.[35]
Polling controversy
[edit]The polling in the election was criticized by Everett Carll Ladd, who argued that "polls had overestimated Clinton's lead during the campaign and had thereby dampened interest in the election."[36] Others such as Warren J. Mitofsky rebutted Ladd's view; in an analysis in Public Opinion Quarterly, Mitofsky wrote that "1996 was not the best but was far from the worst year for the polls", with accuracy surpassing the polling in 1948 and in 1980.[36] Because Clinton won the election by a comfortable margin, there was no major reaction towards the impreciseness of the polls.[36]
See also
[edit]- Presidency of Bill Clinton
- Newspaper endorsements in the 1996 United States presidential election
- 1996 United States gubernatorial elections
- 1996 United States House of Representatives elections
- 1996 United States Senate elections
Notes
[edit]- ^ In New York, the Clinton vote was a fusion of the Democratic and Liberal slates. There, Clinton obtained 3,649,630 votes on the Democratic ticket and 106,547 votes on the Liberal ticket.[28]
- ^ In New York, the Dole vote was a fusion of the Republican, Conservative, and Freedom slates. There, Dole obtained 1,738,707 votes on the Republican ticket, 183,392 votes on the Conservative ticket, and 11,393 votes on the Freedom ticket.[28]
- ^ In South Carolina, the Perot vote was a fusion of the Reform and Patriot slates. There, Perot obtained 27,464 votes on the Reform ticket and 36,913 votes on the Patriot ticket.[28]
- ^ On the California, Indiana, Iowa, Kansas, Louisiana, Maine, Maryland, Missouri, Montana, Oregon, South Dakota, Tennessee, and Texas election ballots, James Campbell of California, Perot's former boss at IBM, was listed as a stand-in vice-presidential candidate until Perot decided on Pat Choate as his choice for Vice President.
- ^ The Green Party vice presidential candidate varied from state to state. Winona LaDuke was his vice presidential candidate in eighteen of the twenty-two states where he appeared on the ballot. Anne Goeke was Nader's running mate in Iowa[30] and Vermont. Madelyn Hoffman was his running mate in New Jersey.[31] Muriel Tillinghast was his running mate in New York.[32]
- ^ Candidates receiving less than 0.05% of the total popular vote.
References
[edit]- ^ "National General Election VEP Turnout Rates, 1789-Present". United States Election Project. CQ Press. Archived from the original on July 25, 2014. Retrieved February 21, 2023.
- ^ "Election Dates". Uselectionatlas.org. Archived from the original on April 3, 2019. Retrieved June 17, 2010.
- ^ "Voter Turnout in Presidential Elections | The American Presidency Project". www.presidency.ucsb.edu. Retrieved November 8, 2024.
- ^ "Anyone left? The search for a Clinton challenger in 1996". The Progressive. TheFreeLibrary.com. May 1, 1995. Archived from the original on April 5, 2019. Retrieved December 6, 2010.
- ^ Newton-Small, Jay (November 24, 2009). "Can a Pro-Life Dem Bridge the Health-Care Divide?". Time. Archived from the original on November 27, 2009. Retrieved December 6, 2010.
- ^ a b Kalb, Deborah, ed. (2010). Guide to U.S. Elections. Washington, DC: CQ Press. pp. 460–461. ISBN 978-1-60426-536-1.
- ^ Kalb, Deborah, ed. (2010). Guide to U.S. Elections. Washington, DC: CQ Press. p. 745. ISBN 978-1-60426-536-1.
- ^ "New Hampshire Republican Forum". C-SPAN.org. February 19, 1995. Retrieved August 7, 2018.
- ^ Washington watch (June 6, 1994). "Republicans Prepare to Run in 1996 – Arab American Institute". Aaiusa.org. Archived from the original on October 1, 2017. Retrieved April 4, 2018.
- ^ Julie Hirschfeld Davis (January 26, 2012), "'Stop-Newt' Republicans Confront New Base" Archived December 2, 2013, at the Wayback Machine Bloomberg News
- ^ Kalb, Deborah, ed. (2010). Guide to U.S. Elections. Washington, DC: CQ Press. p. 744. ISBN 978-1-60426-536-1.
- ^ Hardy, Thomas (September 20, 1996). "Dole Makes Strong Rebound After Fall". Chicago Tribune. Archived from the original on March 25, 2024. Retrieved March 25, 2024.
- ^ Lewis, Matt (September 25, 2008). "McCain and Obama Can Learn A Lot From Past Debaters". Townhall.com. Archived from the original on October 26, 2016. Retrieved August 18, 2016.
It's the age of his ideas that I question
- ^ Berke, Richard L. (October 7, 1996). "Clinton And Dole, Face To Face, Spar Over Medicare And Taxes". The New York Times. Archived from the original on December 7, 2008. Retrieved May 26, 2010.
- ^ "09/02/96 Medicare, Taxes, and Bob Dole: A Talk with the President". Business Week. June 14, 1997. Archived from the original on June 28, 1997. Retrieved June 17, 2010.
- ^ Shields, Mike (February 18, 2016). "An Oral History of The First Presidential Campaign Websites in 1996". The Wall Street Journal. Archived from the original on November 8, 2020. Retrieved November 12, 2020.
- ^ Clyme, Adam (October 23, 1996). "G.O.P. Pushes Congress Strategy That Shuns Dole". The New York Times. Archived from the original on March 7, 2017. Retrieved February 20, 2017.
- ^ Romano, Andrew (August 16, 2016). "Down Ticket #3: Republicans want to keep Congress by sacrificing Trump. Good luck with that". Yahoo! News. Archived from the original on October 10, 2016. Retrieved October 8, 2016.
- ^ a b c "CPD: 1996 Debates". www.debates.org. Archived from the original on January 8, 2019. Retrieved January 8, 2019.
- ^ Woodward, Bob; Duffy, Brian (February 13, 1997). "Chinese Embassy Role In Contributions Probed". The Washington Post. Archived from the original on August 18, 2018. Retrieved September 17, 2017.
- ^ Eskenazi, Michael (March 3, 2000). "For both Gore and GOP, a guilty verdict to watch". CNN. Archived from the original on April 3, 2013.
- ^ Abse, Nathan (June 9, 1998). "A Look at the 94 Who Aren't Talking". The Washington Post. Archived from the original on August 10, 2017. Retrieved September 17, 2017.
- ^ Holmes, Steven A. (November 5, 1992). "The 1992 Elections: Disappointment – News Analysis An Eccentric but No Joke; Perot's Strong Showing Raises Questions On What Might Have Been, and Might Be". The New York Times. Archived from the original on October 14, 2008. Retrieved May 26, 2010.
- ^ a b "AllPolitics – Presidential Election Exit Poll Results". CNN. November 1996. Archived from the original on March 8, 2008. Retrieved February 9, 2008.
- ^ "AllPolitics – Tracking Poll". CNN. November 4, 1996. Archived from the original on February 5, 2008. Retrieved March 4, 2008.
- ^ Sullivan, Robert David; 'How the Red and Blue Map Evolved Over the Past Century' Archived November 16, 2016, at the Wayback Machine; America Magazine in The National Catholic Review; June 29, 2016
- ^ Stone, Daria; Caldwell, Alicia A. (November 6, 1996). "Clinton takes Arizona, nation". Arizona Daily Wildcat. Retrieved August 5, 2024.
- ^ a b c "'96 Presidential and Congressional Election Statistics". Official website of the Office of the Clerk of the House of Representatives. Archived from the original on January 26, 2006. Retrieved February 17, 2006.
- ^ Matthews, Dylan (August 9, 2012). "The effect of veep picks, in two charts". The Washington Post. Archived from the original on December 6, 2014. Retrieved November 27, 2014.
Jack Kemp, whose home state of New York saw an even stronger anti-Republican swing in 1996
- ^ "November 12, 1996" (PDF). Minutes of the Meetings of the Board of Supervisors. Cerro Gordo County. 1996. Archived from the original (PDF) on May 26, 2006. Retrieved March 30, 2006.
- ^ Fernandez, Sonia (February 22, 2000). "Nader '55 to run for president". The Daily Princetonian. Daily Princetonian Publishing Company, Inc. Archived from the original on March 24, 2007. Retrieved March 30, 2006.
- ^ "Electors of President and Vice President". Cattaraugus County: Board of Elections: 1996 Election Results. Cattaraugus County, New York State. Archived from the original on September 28, 2007. Retrieved March 30, 2006.
- ^ a b 1996 Presidential General Election Data - National Archived July 9, 2019, at the Wayback Machine, Uselectionatlas.org.
- ^ Quain, Anthony J. (1999). The Political Reference Almanac, 1999–2000. Keynote Publishing Company. pp. 405, 406, 435, 436. ISBN 978-0-9670286-0-6.
- ^ Connelly, Marjorie (November 10, 1996). "Portrait of the Electorate". The New York Times. Archived from the original on March 12, 2023. Retrieved March 12, 2023.
- ^ a b c Mitofsky, W. J. (1998). "Review: Was 1996 a Worse Year for Polls Than 1948?". The Public Opinion Quarterly. 62 (2): 230–249. doi:10.1086/297842.
Further reading
[edit]Books
[edit]- Ceaser, James W.; Andrew E. Busch (1997). Losing to Win: The 1996 Elections and American Politics. Rowman & Littlefield Publishers. ISBN 0-8476-8405-9.
- Clinton, Bill (2005). My Life. Vintage. ISBN 1-4000-3003-X.
- Dole, Bob; Kemp, Jack (1996). Trusting the People: The Dole-Kemp Plan to Free the Economy and Create a Better America. HarperCollins. ISBN 0-06-101153-3.
- Green, John C. (1999). Financing the 1996 Election. ISBN 0-585-26014-1.
- Moreland, Laurence W.; Steed, Robert P., eds. (1997). The 1996 Presidential Election in the South: Southern Party Systems in the 1990s. Bloomsbury Academic. ISBN 0-275-95951-1.
- Nelson, Michael. Clinton's Elections: 1992, 1996, and the Birth of a New Era of Governance (UP of Kansas, 2020) online.
- Pomper, Gerald M.; et al. (1997). The Election of 1996: Reports and Interpretations. ISBN 0-585-22457-9.
- Srodes, James L.; Arthur Jones (1996). Campaign 1996: Who's Who in the Race for the White House. HarperPaperbacks. ISBN 978-006100993-8.
- Woodward, Bob (1996). The Choice. Simon & Schuster. ISBN 978-068481308-0.
Journals
[edit]- Highton, Benjamin. "Bill Clinton, Newt Gingrich, and the 1998 house elections." Public Opinion Quarterly 66.1 (2002): 1–17. online
- Hillygus, D. Sunshine, and Simon Jackman. "Voter decision making in election 2000: Campaign effects, partisan activation, and the Clinton legacy." American Journal of Political Science 47.4 (2003): 583–596. online
- Immelman, Aubrey. "The political personalities of 1996 US presidential candidates Bill Clinton and Bob Dole." Leadership Quarterly 9.3 (1998): 335–366. online
- Jelen, Ted G.; Marthe Chandler (2000). "Culture Wars in the Trenches: Social Issues as Short-Term Forces in Presidential Elections, 1968–1996". The American Review of Politics. 21: 69–87.
Web references
[edit]- "Libertarian Party Historical Overview". Archived from the original on January 30, 2006. Retrieved January 25, 2006.
- "Fear & Loathing on the Campaign Trail '96". Archived from the original on March 4, 2016. Retrieved December 21, 2011.
External links
[edit]Campaign websites
[edit]- Clinton-Gore 1996 website screen shots Archived November 16, 2012, at the Wayback Machine
- Dole-Kemp Page at the Wayback Machine (archived 1996-11-06) (as of 1996)
- Dole-Kemp 1996 website (still active as of February 2021)
Other links
[edit]- The Election Wall's 1996 Election Video Page
- 1996 popular vote by counties
- 1996 popular vote by states
- 1996 popular vote by states (with bar graphs)
- CNN: 1996 Presidential Campaign Ads
- Popular vote data from the Federal Election Commission
- Choose or Lose at the Wayback Machine (archived December 22, 1996) – MTV pages on the election
- Election of 1996 in Counting the Votes at the Wayback Machine (archived April 4, 2016)
- Documentary about the 1996 Vice Presidential Candidates, "Running Mate", American Archive of Public Broadcasting

